Voices of Industry Channel

It takes a community of embedded designers to develop the myriad applications that are newly available each day. This series gives voice to the members of the embedded design community as they share their experiences and knowledge in their expert application domains so that designers in other application domains can benefit from their lessons learned.

Unit test tools and automatic test generation

Monday, March 19th, 2012 by Mark Pitchford

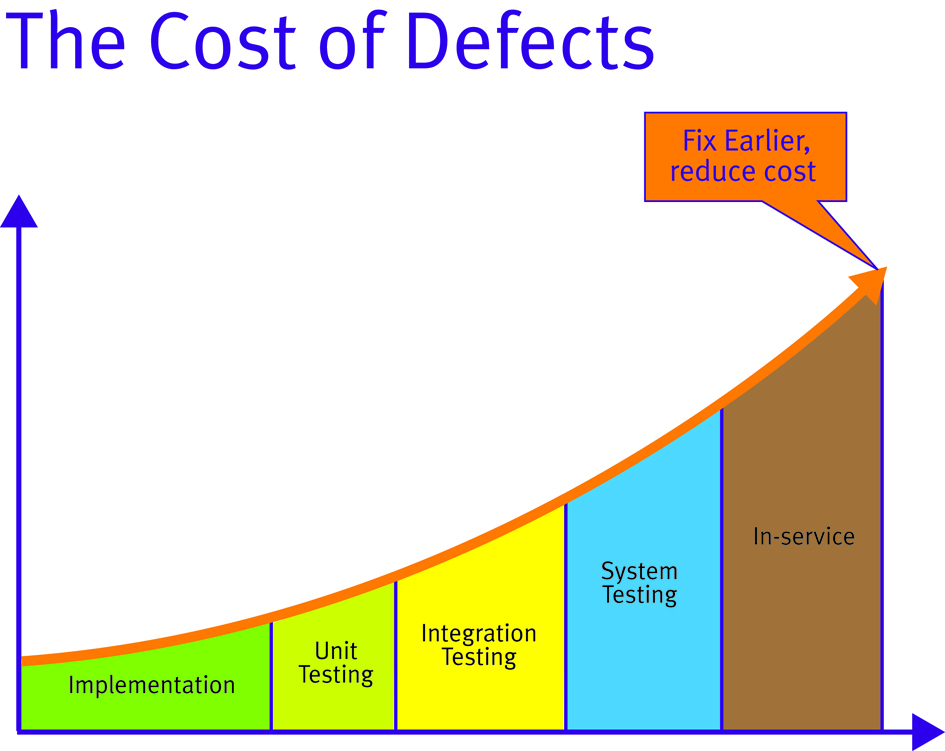
When are unit test tools justifiable? Ultimately, the justification of unit test tools comes down to a commercial decision. The later a defect is found in the product development, the more costly it is to fix  (Figure 1). This is a concept first established in 1975 with the publication of Brooks’ “Mythical Man Month” and proven many times since through various studies.

The later a defect is identified, the higher the cost of rectifying it.

The automation of any process changes the dynamic of commercial justification. This is especially true of test tools given that they make earlier unit test more feasible. Consequently, modern unit test almost implies the use of such a tool unless only a handful of procedures are involved. Such unit test tools primarily serve to automatically generate the harness code which provides the main and associated calling functions or procedures (generically “procedures”). These facilitate compilation and allow unit testing to take place.

The tools not only provide the harness itself, but also statically analyze the source code to provide the details of each input and output parameter or global variable in any easily understood form. Where unit testing is performed on an isolated snippet of code, stubbing of called procedures can be an important aspect of unit testing. This can also be automated to further enhance the efficiency of the approach.

This automation makes the assignment of values to the procedure under test a simpler process, and one which demands little intimate knowledge of the code on the part of the test tool operator. This distance enables the necessary unit test objectivity because it divorces the test process from that of code development where circumstances require it, and from a pragmatic perspective, substantially lowers the level of skill required to develop unit tests.

This ease of use means that unit test can now be considered a viable development option with each procedure targeted as it is written. When these early unit tests identify weak code, the code can be corrected immediately while the original intent remains fresh in the mind of the developer.

Automatically generating test cases

Generally, the output data generated through unit tests is an important end in itself, but this is not necessarily always the case. There may be occasions when the fact that the unit tests have successfully completed is more important than the test data itself. This happens when source code is tested for robustness. To provide for such eventualities, it is possible to use test tools to automatically generate test data as well as the test cases. High levels of code execution coverage can be achieved by this means alone, and the resultant test cases can be complemented by means of manually generated test cases in the usual way.

An interesting application for this technology involves legacy code. Such code is often a valuable asset, proven in the field over many years, but likely developed on an experimental, ad hoc basis by a series of expert “gurus” – expert at getting things done and in the application itself, but not necessarily at complying with modern development practices.

Frequently this SOUP (software of unknown pedigree) forms the basis of new developments which are obliged to meet modern standards either due to client demands or because of a policy of continuous improvement within the developer organization. This situation may be further exacerbated by the fact that coding standards themselves are the subject of ongoing evolution, as the advent of MISRA C:2004 clearly demonstrates.

If there is a need to redevelop code to meet such standards, then this is a need to not only identify the aspects of the code which do not meet them, but also to ensure that in doing so the functionality of the software is not altered in unintended ways. The existing code may well be the soundest or only documentation available and so a means needs to be provided to ensure that it is dealt with as such.

Automatically generated test cases can be used to address just such an eventuality. By generating test cases using the legacy code and applying them to the rewritten version, it can be proven that the only changes in functionality are those deemed desirable at the outset.

The Apollo missions may have seemed irrelevant at the time, and yet hundreds of everyday products were developed or modified using aerospace research—from baby formula to swimsuits. Formula One racing is considered a rich man’s playground, and yet British soldiers benefit from the protective qualities of the light, strong materials first developed for racing cars. Hospital patients and premature babies stand a better chance of survival than they would have done a few years ago, thanks to the transfer of F1 know-how to the medical world.

Likewise, unit testing has long been perceived to be a worthy ideal—an exercise for those few involved with the development of high-integrity applications with budgets to match. But the advent of unit test tools offer mechanisms that optimize the development process for all. The availability of such tools has made this technology and unit testing itself an attractive proposition for applications where sound, reliable code is a commercial requirement, rather than only those applications with a life-and-death imperative.

Unit, Regression and System Testing

Monday, February 20th, 2012 by Mark Pitchford

While unit testing at the time of development is a sound principle to follow, all too often ongoing development compromises the functionality of the software that is already considered complete. Such problems are particularly prevalent when adding functionality to code originally written with no forethought for later enhancements.

Regression testing is what’s needed here. By using a test case file to store a sequence of tests created for the original SOUP (Software of Unproven Pedigree), it is possible to recall and reapply it to the revised code to prove that none of the original functionality has been compromised.

Once configured, this regression testing can be initiated as a background task and run perhaps every evening. Reports highlight any changes to the output generated by earlier test runs. In this way, any code modifications leading to unintentional changes in application behavior can be identified and rectified immediately.

Modern unit test tools come equipped with user-friendly, point-and-click graphical user interfaces. However, when faced with thousands of test cases, a GUI interface is not always the most efficient way to handle the development of test cases. In recognition of this, test tools are designed to allow these test case files to be directly developed from applications such as Microsoft Excel. As before, the “regression test” mechanism can then be used to run the test cases held in these files.

Unit and system test in tandem

Traditionally, many applications have been tested by functional means only. The source code is written in accordance with the specification, and then tested to see if it all works. The problem with this approach is that no matter how carefully the test data is chosen, the percentage of code actually exercised can be very limited.

That issue is compounded by the fact that the procedures tested in this way are only likely to handle data within the range of the current application and test environment. If anything changes a little – perhaps in the way the application is used or perhaps as a result of slight modifications to the code – the application could be running entirely untested execution paths in the field.

Of course, if all parts of the system are unit tested and collated on a piecemeal basis through integration testing, then this will not happen. But what if timescales and resources do not permit such an exercise? Unit test tools often provide the facility to instrument code. This instrumented code is equipped to “track” execution paths, providing evidence of the parts of the application which have been exercised during execution. Such an approach provides the information to produce data such as that depicted in Figure 1.

Color-coded dynamic flow graphs and call graphs illustrate the parts of the application which have been exercised. In this example, note that the red coloring highlights exercised code.

Code coverage is an important part of the testing process in that it shows the percentage of the code that has been exercised and proven during test. Proof that all of the code has been exercised correctly need not be based on unit tests alone. To that end, some unit tests can be used in combination with system test to provide a required level of execution coverage for a system as a whole.

This means that the system testing of an application can be complemented by unit tests that execute code which would not normally be exercised in the running of the application. Examples include defensive code (e.g., to prevent crashes due to inadvertent division by zero), exception handlers, and interrupt handlers.

Unit test is just one weapon in the developer’s armory. By automatic use of unit test both in isolation and in tandem with other techniques, the development of robust and reliable software doesn’t need to carry the heavy development overhead it once did.

Unit testing: why bother?

Tuesday, October 25th, 2011 by Mark Pitchford

Unit test? Great in theory, but…

Unit test has been around almost as long as software development itself. It just makes sense to take each application building block, build it in isolation, and execute it with test data to make sure that it does just what it should do without any confusing input from the remainder of the application.

Without automation, the sting comes from not being able to simply lift a software unit from its development environment, compile and run it – let alone supply it with test data. For that to happen, you need a harness program acting as a holding mechanism that calls the unit, details any included files, “stubs” written to handle any procedure calls by the unit, and offers any initialization sequences which prepare data structures for the unit under test to act upon. Not only is creating that process laborious, but it takes a lot of skill. More often than not, the harness program requires at least as much testing as the unit under test.

Perhaps more importantly, a fundamental requirement of software testing is to provide an objective, independent view of the software. The very intimate code knowledge required to manually construct a harness compromises the independence of the test process, undermining the legitimacy of the exercise.

Deciding when to unit test

Unit test is not always justifiable and can vary in extent and scope depending on commercial issues such as the cost of failure in the field or the time unit testing will take.

To determine whether to move forward, you need to ask a couple of questions:

  • If unit testing is to take place, how much is involved?
  • Is it best to invest in a test tool, or is it more cost effective to work from first principles?

Developers must make pragmatic choices. Sometimes the choice is easy based on the criticality of the software. If the software fails, what are the implications? Will anyone be killed, as might be the case in aircraft flight control? Will the commercial implications be disproportionately high, as exemplified by a continuous plastics production plant? Or are the costs of recall extremely high, perhaps in a car’s engine controller? In these cases, extensive unit testing is essential and any tools that aid in that purpose make sense. On the other hand, if software is developed purely for internal use or is perhaps a prototype, then the overhead in unit testing all but the most vital of procedures would be prohibitive.

As you might expect, there is a grey area. Suppose the application software controls a mechanical measuring machine where the quantity of the devices sold is low and the area served is localized. The question becomes: Would the occasional failure be more acceptable than the overhead of unit test?

In these circumstances, it’s useful to prioritize the parts of the software which are either critical or complex. If a software error leads to a strangely colored display or a need for an occasional reboot, it may be inconvenient but not justification for unit testing. On the other hand, the unit test of code which generates reports showing whether machined components are within tolerance may be vital.

Beyond unit test

For some people, the terms “unit test” and “module test” are synonymous. For others, the term “unit” implies the testing of a single procedure, whereas “module” suggests a collection of related procedures, perhaps designed to perform some particular purpose within the application.

Using the latter definitions, manually developed module tests are likely to be easier to construct than unit tests, especially if the module represents a functional aspect of the application itself. In this case, most of the calls to procedures are related and the code accesses related data structures, which makes the preparation of the harness code more straightforward.

Test tools render the distinction between unit and module tests redundant. It is entirely possible to test a single procedure in isolation and equally possible to use the exact same processes to test multiple procedures, a file, or multiple files of procedures, a class (where appropriate), or a functional subset of an entire system. As a result, the distinction between unit and module test is one which has become increasingly irrelevant to the extent that the term “unit test” has come to include both concepts.

Such flexibility facilitates progressive integration testing. Procedures are first unit tested and then collated as part of the subsystems, which in turn are brought together to perform system tests. It also provides options when a pragmatic approach is required for less critical applications. A single set of test cases can exercise a specified procedure in isolation, with all of the procedures called as a result of exercising the specified procedure, or anything in between (See Figure 1). Test cases that prove the functionality of the whole call chain are easily constructed. Again, it is easy to “mix and match” the processes depending on the criticality of the code under review.

A single test case (inset) can exercise some or all of the call chain associated with it. In this example, “AdjustLighting,” note that the red coloring highlights exercised code.

This all embracing unit test approach can be extended to multithreaded applications. In a single-threaded application, the execution path is well-defined and sequential, such that no part of the code may be executed concurrently with any other part. In applications with multiple threads, there may be two or more paths executed concurrently, with interaction between the threads a commonplace feature of the system. Unit test in this environment ensures that particular procedures behave in an appropriate manner both internally and in terms of their interaction with other threads.

Sometimes, testing a procedure in isolation is impractical. For instance, if a particular procedure relies on the existence of some ordered data before it can perform its task, then similar data must be in place for any unit test of that procedure to be meaningful.

Just as unit test tools can encompass many different procedures as part of a single test, they can also use a sequence of tests with each one having an effect on the environment for those executed subsequently. For example, unit testing a procedure which accesses a data structure may be achieved by first implementing a test case to call an initialization procedure within the application, and then a second test case to exercise the procedure of interest.

Unit test does not imply testing in only the development environment. Integration between test tools and development environments means that unit testing of software can take place seamlessly using the compiler and target hardware. This is another example of the development judgments required to find an optimal solution – from performing no unit test at all, through to testing all code on the target hardware. The trick is to balance the cost of test against the cost of failure, and the overhead of manual test versus the investment cost in automated tools.

The Engineer: Marketing’s Secret Weapon

Monday, August 29th, 2011 by Rae Morrow and Bob Frostholm

For many engineers the most exciting part of developing a product is being able to say, “it’s done!” But this really isn’t the end of the cycle, getting the product to the market is the developer’s next step. Projects that involve engineers in the marketing process reap added benefits. Technical teams exploring your product, without exception, are more open with their information when speaking with you engineers. By taking advantage of this “brotherhood of engineers” bond, designers can glean insights into future needs and requirements to gain an early leg up on their next generation products.

Marketeers spend hours upon hours developing branding campaigns, datasheets, technical articles, ads, brochures, PowerPoint presentations, application notes, flashy web pages, and more to assist the sales force in winning a potential buyer’s trust and eventually their business. The quality of these tools is critical to the success of the front line salesperson. When these tools are inadequate, creativity steps in and all too often “winging it” results in some degree of lost credibility. We have all experienced the over exuberance of a salesperson trying to embellish their product beyond the point of believability.

Creating dynamite sales tools requires forethought and planning. It begins with a thorough understanding of the product’s value propositions. Whether the product concept is originated within the marketing department or the engineering department, it is the engineers who have to embed the values into the new product. Marketeers then need to extract those values from engineering in the form of features and benefits that can be translated easily into ‘sales-speak’. The information flow has gone from engineer to marketer to sales person to potential buyer.

There are dozens of different channels through which information is delivered to a potential buyer. It requires discipline to keep the message consistent across all of them.

Think back to your first grade class, when on a rainy day, the teacher gathered everyone in a circle and whispered something into the ear of the child to the right and then asked them to do the same to the child to their right. By the time the information came full circle to the teacher, it barely resembled the original message. Today, there are dozens of different channels through which information is delivered to a potential buyer. The critical technical information, that which can make or break a sale, originates in Engineering (See Figure).

It is obvious how confusing the message can become when the buyer is barraged with dozens of interpretations.  Some channels truncate the message to fit their format (how much can be communicated in 140 characters?) while others will rewrite and add interpretations and comparative analysis. In the end, the buyer does not know who to believe.

There are several ways to assure your company is delivering strong and consistent messaging. For some companies this means retaining a dedicated person in the marcom department with strong technical writing and organizational skills. Another solution is to work with a PR (public relations) firm that focuses on the electronic industry, and their team focuses on the timeliness of the communications flow and manages the various channels for consistency within the channel as well.

When all the basics have been covered, it is then time to deploy the secret weapon; the engineer. Placing engineers face to face with potential buyers is becoming a more common occurrence. The buyer’s appetite for the product has been stimulated by marketing’s branding and product positioning.  Properly executed, the positioning has resulted in several third party endorsements that the buyer cannot refute.

Exposing the knowledge, skills, and expertise of the engineering team furthers the confidence of potential buyers in their decision making process. Face to face does not necessarily mean flying the engineer half way around the world for a 1 hour meeting, although there are occasions where this may be necessary. Other equally effective techniques include:

  1. Publish “How To” articles, authored by the engineer-expert. Many times these are ghost written on the basis of inputs supplied by the engineer. A creative marketing effort will find many ways to promote and repurpose this content, whether in multiple regional markets or in different formats such as application notes, presentations, and Q&As.
  2. Host webinars that allow many potential buyers to simultaneously participate in a technical lecture or series of lectures provided by the engineer-expert. There is significant effort required for planning, promoting, and executing to ensure a qualified audience is in attendance.
  3. Publish “opinion” or ‘white” papers that address a general industry concern and offer pragmatic approaches to solutions demonstrate a level of expertise by the engineer.

While we often stereotype engineers as the ‘Dilberts’ or ‘Wallys’ of the world, they are in fact one of a company’s best assets in closing a sale. They deal in a world of facts and figures, and equations and laws of nature that do not change. They abhor vagueness and embrace truth. To the buyer, their word is golden. In the buyer’s mind, ‘they are one of us’.

It is difficult to avoid the adversarial nature of a sale. We’ve been taught that there is a winner and a loser in the transaction. Involving the engineer in the process can greatly lessen the tension and extract clearly the real value of the product to the buyer, yielding a win-win scenario.

Requirements for tablet handwriting input

Monday, July 11th, 2011 by Guillaume Largillier

The market for tablet computers is exploding, with an estimated 100 million units that will be in use by 2013. The tablet form factor is very compelling because of its small size, light weight, and long battery life. Also, tablet operating systems, like Android, MeeGo, and iOs, have been designed so the input mechanism is touch-oriented, making their applications fun and easy to use.

One such tablet, the Apple iPad, has been a phenomenal success as a media-consumption device for watching movies, reading e-mail, surfing the Web, playing games, and other activities. But one thing is missing to make it the only device you need when going on a business trip: pen input. Pen input facilitates handwriting and drawing, which is important because our brain connectivity and the articulation in our arms, elbows, wrists, and fingers give us much greater motor skills when we use a tool. Everybody needs a pen, including children learning how to draw and write, engineers sketching a design, and business people annotating a contract.

Natural handwriting involves many contact points to be discriminated.

Accordingly, the ultimate goal for tablet designers should be to replicate the pen-and-paper experience. Pen and paper work so well together: resolution is high, there is no lag between the pen movement and the depositing of ink, and you can comfortably rest your palm on the paper, with its pleasing texture.

These qualities, however, are not easy to replicate in a tablet computer. You need high responsiveness, high resolution, good rendering, and palm rejection. Writing on a piece of glass with a plastic stylus is not an especially pleasing experience, so you also need coating on the glass and a shape and feel of a stylus that can approximate the pen and paper experience. Most importantly, you need an operating system and applications that have been designed from the ground up to integrate this input approach.

A key part of the equation is multi-touch technology that knows whether a particular finger touching the device is merely holding it or activating a menu, whether a certain contact point is a finger or a stylus, and, more importantly, it needs to distinguish a palm resting on the top of the display so a user can comfortably write on the device. In short, handwriting on a tablet computer doesn’t require multi-touch per se but smart detection of what’s happening on the screen.

The typical iVSM layout

Interpolated voltage sensing matrix (iVSM) is a multi-touch technology that provides smart detection, including handwriting rendering and palm rejection. It can allow users to simultaneously move a pen or a stylus (and an unlimited number of fingers) on a screen. iVSM is similar to projected capacitive technology, as it employs conductive tracks patterned on two superimposed substrates (made of glass or hard plastic). When the user touches the sensor, the top layer slightly bends, enabling electrical contact between the two patterned substrates at the precise contact location (Figure 3). A controller chip scans the whole matrix to detect such contacts, and will track them to deliver cursors to the host. However, whereas capacitive technology relies on proximity sensing, iVSM is force activated, enabling it to work with a pen, a stylus, or any number of implements. 

iVSM layout cut view

The tablet computer revolution is well underway around the world, with handwriting becoming an increasingly necessary function. Accordingly, device designers and vendors should take proper heed, or they might soon be seeing the handwriting on the wall.

Implementing system-wide load balancing

Friday, May 20th, 2011 by Carolina Blanch and Rogier Baert and Maja DHondt

To enable intelligent adaptation for multiprocessing designs that perform system-wide load balancing, we implemented several functions and added these to the processors. Examples of these functions are constant resource and workload monitoring as well as bandwidth monitoring of the network link. This allows the device to promptly react to situations where (1) the workload exceeds the available resources, which can occur due to variations in the workload as well as (2) reductions of the available processing power, due to running down the batteries for example. In both cases, the processing of some tasks should be transferred to more powerful devices on the network.

In our experiment, device A and device B both implement the decoding of video streams, followed by an image analysis function (logo-detector used for quality control) and re-encoding of the video streams (See Figure 2). Depending on the resource availability at either device, some stream processing tasks are transferred seamlessly to the less overloaded device. Finally, the output of all processed streams is sent to a display client. This task migration automatically lowers the workload at the overloaded device while all videos are visualized without any artifacts.

Load balancing at the system level involves migrating tasks between devices in the network.

We implement a Device Runtime Manager (RM) at each device that takes care of the monitoring of workload, resources, video quality, and link bandwidth within each device.Note that bandwidth monitoring is required to guarantee that the processed data can be accommodated in the available bandwidth.

While the Device RM can take care of the load balancing within the device, a Network Runtime Manager is implemented to perform the load balancing between devices in the network. To do so, it receives the monitored information from each individual Device RM and decides where, on which device, to execute each task. This way, when resources at Device A are insufficient for the existing workload the Network RM shifts some stream processing tasks from Device A to B. Obviously, this task distribution between device A and B depends on the resource availability at both devices. In our experiment the screen on the client display shows in which device each displayed video stream is currently processed. In the example in Figure 2, due to lack of resources in device A, the processing of 6 video streams has been migrated to device B while the remaining 3 have been processed on device A.

In a similar way, Figure 3 shows the monitored workload on both device A and B. Around time 65s, several stream processing tasks are added to device A, causing its overload. To decrease the load of device A the Network RM gradually shifts tasks from device A to device B resulting in the load distribution given from time 80s on. This way, load balancing between devices in the network overcomes the processing limitations of device A.

The processing load distribution over time for devices A and B.

Another way to implement load balancing between devices would be by means of down-scaling the task requirements. For video decoding applications for example, this may translate into reducing the spatial or temporal resolution of the video stream. In another experimental setup, when the workload on a decoding client becomes too high, the server transcodes the video streams to a lower resolution before sending them to the client device. This naturally reduces the workload on the device client at the cost of an increased processing at the server.

Note that we chose to place the Network RM at device A, but it could be located at any other network device as the overhead involved is very low. Note also that in both experiments the decision to migrate tasks or adapt the contents is taken to fit the processing constraints and to guarantee the desired quality-of-service.

However, another motivation for load balancing can be to minimize the energy consumption at a specific device, extending its battery lifetime, or even controlling the processors’ temperature. Think of cloud computing data centers where cooling systems are critical and account for a big fraction of the energy consumed. Load balancing between servers could be used to control the processors temperature by switching on an off processors or switching tasks between them. This could potentially reduce the cooling effort and pave the way for greener and more efficient data centers.

We are facing a future where applications are becoming increasingly complex and demanding with a highly dynamic and unpredictable workload. To tackle these challenges we require high flexibility of adaptation and cooperation from devices in the network. Our research and experimentscontribute to an environment with intelligent and flexible devices that are able to optimally exploit and share their resources and those available in the network while adapting to system dynamics such as workload, resources and bandwidth.

Dynamic runtime task assignment

Tuesday, April 19th, 2011 by Carolina Blanch and Rogier Baert and Maja DHondt

Innovative multimedia applications – think of multi-camera surveillance or multipoint videoconferencing – are demanding both in processing power and bandwidth requirements. Moreover, a video processing workload is highly dynamic and subject to stringent real-time constraints. To process these types of applications, the trend is to use commodity hardware, because it provides higher flexibility and reduces the hardware cost. This hardware is often heterogeneous, a mix of central processing units (CPUs), graphic processing units (GPUs) and digital signal processors (DSPs).

But implementing these multimedia applications efficiently onto one or more heterogeneous processors is a challenge, especially if you also want to take into account the highly dynamic workload. State-of-the-art solutions tackle this challenge through fixed assignments of specific tasks to types of processors. However, such static assignments lack the flexibility to adapt to workload or resource variations and often lead to poor efficiency and over-dimensioning.

Another strategy would be to implement dynamic task assignment. To prove that this is feasible, we have implemented middleware that performs both run-time monitoring of workloads and resources, and runtime task assignment onto and between multiple heterogeneous processors. As platforms, we used the NVidia Quadro FX3700 and dual Intel quad core Xeon processors.

Load-balancing between the cores of a device

Our experiment consists of running multiple pipelines where MPEG-4 decoding, frame conversion and AVC video encoding are serialized tasks. From all these tasks, the most demanding motion estimation task, part of video encoding, can be run either on a CPU or it can be CUDA-accelerated on the GPU. Figure 1 compares our experimental runtime assignment strategy with two static assignment strategies that mimic the behavior of state-of-the-art OS-based systems.

This chart shows how the throughput increases by dynamic task assignment within a device.

The first static assignment considered consists of letting the operating system assign all tasks onto the CPU cores. The second one assigns all CUDA-accelerated tasks on the GPU while the remaining tasks are scheduled on the CPU cores. We can see how the latter one, enabling GPU-implementable versions of the most demanding tasks, increases the number of streams that can be processed from 10 to 15. However at this point, the GPU becomes the bottleneck and it limits the number of processed frames.

The last, dynamic, strategy overcomes both CPU and GPU limitations and bottlenecks by finding at runtime an optimal balance between CPU and GPU assignments. By doing so, an increased throughput of 20% is achieved in comparison with fixed assignments to GPU and CPU. This way, the efficiency and flexibility of the available hardware is increased while the overhead remains marginal, around 0.05% of the total execution time.

From the device to the cloud

Load balancing within the device is a first step that is necessary to maximize the device’s capabilities and to cope with demanding and variable workloads. But to overcome the limited processing capacity of a device, a second step is needed: load balancing at the system level. Only this will allow exploiting the potential of a highly connected environment where resources from other devices can be shared.

In addition, today’s applications tend to become more complex and demanding in both processing and bandwidth terms. On top of this, users keep demanding lighter and portable multifunctional devices where longer battery duration is desirable. Naturally, this poses serious challenges for these devices to meet the processing power required by many applications.

The way to solve this is by balancing the load between multiple devices, by offloading tasks from overloaded or processing-constrained devices to more capable ones that can process these tasks remotely. This is linked to “thin client” and “cloud computing” concepts where the limited processing resources on a device are virtually expanded by shifting processing tasks to other devices in the same network.

As an example, think of home networks or local area networks through which multiple heterogeneous devices are connected. Some of these devices are light portable devices such as I-phones and PDAs with limited processing capabilities and battery, while others are capable of higher processing such as media centers or desktops at home, or other processing nodes/servers in the network infrastructure.

One consequence from migrating tasks from lighter devices to more capable ones is that the communication and throughput between devices increases. In particular, in the case of video applications, where video is remotely decoded and transmitted, the bandwidth demand can be very high. Fortunately, upcoming wireless technologies are providing increasingly high bandwidth and connectivity enabling load balancing. This is the case of LTE femto cells where up to 100 Mbps downlink are available, or wireless HD communications systems in the 60GHz range where even 25Gbps are promised.

However, meeting the bandwidth needs is only one of the many challenges posed. Achieving efficient and flexible load balancing in the network also requires a high degree of cooperation and intelligence from devices in the network. This implies not only processing capabilities at the network side but also monitoring, decision making, and signaling capabilities.

Experimental work at imec has shown that, as challenging as it may sound, the future in which all devices in the network efficiently communicate and share resources is much closer than we think.

Boosting energy efficiency – Energy debugging

Monday, April 4th, 2011 by Oyvind Janbu

Using an ultra low power microcontroller alas does not by itself mean that an embedded system designer will automatically arrive at the lowest possible energy consumption.  To achieve this, the important role of software also needs to be taken into account.  Code needs to be optimized, not just in terms of functionality but also with respect to energy efficiency.  Software has perhaps never really been formally identified as an ‘energy drain’ and it needs to be.  Every clock cycle and line of code consumes energy and this needs to be minimized if best possible energy efficiency is to be achieved.

While the first two parts of this article have proposed the fundamental ways in which microcontroller design needs to evolve in the pursuit of real energy efficiency, so this third part considers how the tools which support them also need to change.  Having tools available that provide developers with detailed monitoring of their embedded systems’ energy consumption is becoming vital for many existing and emerging energy sensitive battery-backed applications.

As a development process proceeds, code size naturally increases and optimizing it for energy efficiency becomes a much harder and time-consuming task.  Without proper tools, identifying a basic code error such as a while loop that should have been replaced with an interrupt service routine can be difficult.  Such a simple code oversight causes a processor to stay active waiting for an event instead of entering an energy saving sleep mode – it therefore matters!  If these ‘energy bugs’ are not identified and corrected during the development phase then they’re virtually impossible to detect in field or burn-in tests.  Add together a good collection of such bugs and they will have an impact on total battery lifetime, perhaps critically so.

In estimating potential battery lifetimes, embedded developers have been able to use spreadsheets provided by microcontroller vendors to get a reasonable estimation of application behavior in terms of current consumption.  Measurements of a hardware setup made by an oscilloscope or multimeter and entered into spreadsheets can be extrapolated to give a pretty close estimation of battery life expectancy.  This approach however does not provide any correlation between current consumption and code and the impact of any bugs – the application’s milliamp rating is OK, but what’s not known is whether it could be any better.

With a logic analyzer a developer gets greater access to the behavior of the application and begins to recognize that ‘something strange’ is going on.  Yes it’s a ‘code view’ tool, and shows data as timing diagrams, protocol decodes, state machine traces, assembly language or its correlation with source level software, however it offers no direct relationship with energy usage.

Combine the logic analyzer, the multimeter, and the spreadsheet and you do start to make a decent connection between energy usage and code, but the time and effort spent in setting up all the test equipment (and possibly repeating it identically on numerous occasions), making the measurements and recording them into spreadsheets can be prohibitive if not practically impossible.

Low power processors such as the ARM Cortex-M3 however are already providing a SWO (serial wire output) that can be used to provide quite sophisticated and flexible debug and monitoring capabilities that tool suppliers can harness to enable embedded developers to directly correlate code execution with energy usage.

Simple development platforms can be created which permanently sample microcontroller power rail current consumption, convert it, and send it along with voltage and timing data via USB to a PC-based energy-to-code profiling tool.  Courtesy of the ARM’s SWO pin, the tool can also retrieve program counter information from the CPU.  The coming together of these two streams of data enables true ‘energy debugging’ to take place.

Provided that current measurements have a fairly high dynamic range, say from 0.1µA to 100mA, then it’s possible to monitor a very wide and practical range of microcontroller current consumption.  Once uploaded with the microcontroller object code, the energy profiling tool then has all the information resources it needs to accurately correlate energy consumption with code.

The energyAware Profiler tool from Energy Micro shows the relationship between current consumption, C/C++ code, and the energy used by a particular function. Clicking on a current peak, top right, reveals the associated code, bottom left.

The tool correlates the program-counter value with machine code, and because it is aware of the functions of the C/C++ source program, it can then readily indicate how energy use changes as various functions run.  So the idea of a tool that can highlight to a developer in real time, an energy-hungry code problem comes to fruition.  The developer watches a trace of power versus time, identifies a surprising peak, clicks on it and is immediately shown the offending code.

Such an ability to identify and rectify energy drains in this way and at an early stage of prototype development will certainly help reduce the overall energy consumption of the end product, and it will not add to the development time either, on the contrary.

We would all be wise to consider the debug process of low power embedded systems development as becoming a 3-stage cycle from now on:  hardware debugging, software functionality debugging, and software energy debugging.

Microcontroller development tools need to evolve to enable designers to identify wasteful ‘energy bugs’ in software during the development cycle.  Discovering energy-inefficient behavior that endanger battery lifetime during a product field trial is after all rather costly and really just a little bit too late!

Boosting energy efficiency – Sleeping and waking

Friday, March 18th, 2011 by Oyvind Janbu

While using a 32-bit processor can enable a microcontroller to stay in a deep-sleep mode for longer, there is nevertheless some baseline power consumption which can significantly influence the overall energy budget. However, historically 32-bit processors have admittedly not been available with useful sub-µA standby modes. With the introduction of power efficient 32-bit architectures, the standby options are now complementing the reduced processing and active time.

With the relatively low power consumption many microcontrollers exhibit in deep sleep, the functionality they provide in these modes is often very limited.  Since applications often require features such as real time counters, power-on reset / brown-out detection or UART reception to be enabled at all times, many microcontroller systems are prevented from ever entering deep sleep since such basic features are only available in an active run mode.  Many microcontroller solutions also have limited SRAM and CPU state retention in sub-µA standby modes, if at all.  Other solutions need to turn-off or duty-cycle brown-out and power-on reset detectors in order to save power.

In the pursuit of energy efficiency then microcontrollers need to provide product designers with a choice a sleep modes offering the flexibility to scale basic resources, and thereby the power consumption, in several defined levels or energy modes.  While energy modes constitute a coarse division of basic resources, additional fine-grained tuning of resources within each energy mode should also be able to be implemented by enabling / disabling individual peripheral functions.

There’s little point though in offering a microcontroller with tremendous sleep mode energy consumption if its energy efficiency gains are lost due to the time it takes for the microcontroller to wake up and enter run mode.

When a microcontroller goes from a deep sleep state, where the oscillators are disabled, to an active state, there is always a wake-up period, where the processor must wait for the oscillators to stabilize before starting to execute code.  Since no processing can be done during this period of time, the energy spent while waking up is wasted energy, and so reducing the wake-up time is important to reduce overall energy consumption.

Furthermore, microcontroller applications impose real time demands which often mean that the wake-up time must be kept to a minimum to enable the microcontroller to respond to an event within a set period of time.  Because the latency demanded by many applications is lower than the wake-up time of many existing microcontrollers, the device is often inhibited from going into deep sleep at all – not a very good solution for energy sensitive applications.

A beneficial solution would be to use a very fast RC oscillator that instantly wakes up the CPU and then optionally transfers the clock source to a crystal oscillator if needed. This meets both the real time demands as well as encourages run- and sleep mode duty cycling. Albeit the RC oscillator is not as accurate as a crystal oscillator, the RC oscillator is sufficient as the CPUs clock source during crystal start-up.

We know that getting back to sleep mode is key to saving energy. Therefore the CPU should preferably use a high clock frequency to solve its tasks more quickly and efficiently.  Even if the higher frequency at first appears to require more power, the advantage is a system that is able to return to low power modes in a fraction of the time.

Peripherals however might not need to run at the CPU’s clock frequency.  One solution to this conundrum is to pre-scale the clock to the core and peripherals, thereby ensuring the dynamic power consumption of the different parts is kept to a minimum.  If the peripherals can further operate without the supervision of the CPU, we realize that a flexible clocking system is a vital requirement for energy efficient microcontrollers.

The obvious way for microcontrollers to use less energy is to allow the CPU to stay asleep while the peripherals are active, and so the development of peripherals that can operate with minimum or no intervention from the CPU is another worthy consideration for microcontroller designers.  When peripherals look after themselves, the CPU can either solve other high level tasks or simply fall asleep, saving energy either way.

With advanced sequence programming, routines for operating peripherals previously controlled by the CPU can be handled by the peripherals themselves.  The use of a DMA controller provides a pragmatic approach to autonomous peripheral operation.  Helping to offload CPU workload to peripherals, a flexible DMA controller can effectively handle data transfers between memory and communication or data processing interfaces.

Of course there’s little point in using autonomous peripherals to relieve the burden of the CPU if they’re energy hungry.  Microcontroller makers also need to closely consider the energy consumption of peripherals such as serial communication interfaces, data encryption/decryption engines, display drivers and radio communication peripherals.  All peripherals must be efficiently implemented and optimized for energy consumption in order to fulfill the application’s need for a low system level energy consumption.

Taking the autonomy ideal a step further, the introduction of additional programmable interconnect structures into a microcontroller enable peripherals to talk to peripherals without the intervention of the CPU, thereby reducing energy consumption even further.  A typical example of a peripheral talking to another peripheral would be an ADC conversion periodically triggered by a timer. A flexible peripheral interconnect allows direct hardware interaction between such peripherals, solving the task while the CPU is in its deepest sleep state.

The third part of this three part article explores the tools and techniques available for energy debugging.

Green with envy: Why power debugging is changing the way we develop code

Friday, March 4th, 2011 by Shawn Prestridge

As time passes, consumers demand more from their mobile devices in terms of content and functionality, and this demand has eroded the ability of battery technology to keep up with our insatiable appetite for capability.  The notion of software power debugging is assisting the development engineer to create more ecologically sound devices based on the ability to see how much power is consumed by the device and correlating this to the source code.  By doing statistical profiling of the code with respect to power, an engineer has the ability to understand the impact of their design decisions on the mobile devices that they create.  Armed with this information, the engineer will be able to make more informed decisions about how the code is structured to both maximize battery life and minimize the impact on our planet’s natural resources.

Anyone who has a modern smartphone can attest to their love/hate relationship to it – they love the productivity boost it can provide, the use of GPS functionality to help us find our destination and the ability to be connected to all aspects of their lives, be it via text messaging, e-mail or social networking. But all of this functionality comes at a great cost – it is highly susceptible to the capacity of the battery and can even have a deleterious impact on the life of the battery as the battery can only withstand a certain number of charge cycles.  There are two ways that this problem can be approached: either increase the energy density of the battery so that it can hold a greater mAh rating for the same size and weight or to pay special attention to eliminating extraneous power usage wherever possible.  The problem with the former is that advances in energy storage technology have been far outstripped by the power requirements of the devices they serve.  Thus, we are left with the choice of minimizing the amount of power consumed by the device.

Efforts to reduce the power footprint of a device have been mostly ad-hoc or out of the control of the device’s development engineers, e.g. improvements in wafer technology give the ability to space transistors closer together to cut down on power consumption via reduced capacitances.  However, power debugging gives a modern development engineer the ability to see how their code decisions impact the overall power consumption of the system by tying the measurements of power being supplied to the system with the program counter of the microcontroller.  Power debugging can give you the ability to see potential problems before you go to manufacturing of production hardware.  For example, you may have a peripheral that the engineer thought was deactivated in their code, but in reality is still active and consuming power.  By looking at the power graph, the engineer has the contextual clue that the power consumption of the device is more than it should be and warrants an inspection of the devices that are active in the system that are consuming energy.

Another example of how power debugging can assist an engineer is by looking at the duty cycles of their microcontroller.  A common design paradigm in battery-powered electronics is to wake up from some sort of power-saving sleep mode, do the processing required and then return to the hibernation state.  This is relatively simple to code, but the engineer may not be aware that there is an external stimulus causing the microcontroller to rouse from the sleep mode prematurely and thus causing the power consumption to be higher than it should.  It is also possible that an external signal is occurring more often than was planned in the original design specification.  While this case can be traced with a very judicious use of breakpoints, the problem may persist for quite some time before the behavior is noticed.  A timeline view of the power consumption can foreshorten this latent defect because it can evince these spikes in current and allow the engineer to double-click the spike to see where in the code the microcontroller was executing when the spike occurred, thus providing the engineer with the information necessary to divine what is happening to cause the power requirements to be so high.

Power debugging can also provide statistical information about the power profile of a particular combination of application and board.  This can be used in baselining the power consumption in such a way that if the engineer adds or changes a section of code in the application and then sees the power differ drastically from the baseline, then the engineer knows that something in the code section they just added or modified caused the spike and can investigate further what is happening and how to mitigate it.  Moreover, an engineer can change microcontroller devices to see if the power consumption of one device is lower or higher than that of another device, thus giving a commensurate comparison between the two devices.  This allows the engineer to make very scrupulous decisions about how their system is constructed with respect to power consumption.

It is evident that our consumer society will begin to rely increasingly on mobile devices which will precipitate demand for more capability and – correspondingly – more power from the batteries which drive these devices.  It behooves an engineer to make their design last as long as possible on a single battery charge, so particular attention must be paid to how the design is constructed – both in hardware and software – to maximize the efficiency of the device.  Power debugging gives the engineer the tools necessary to achieve that goal of making a more ecologically-friendly device that makes every electron count.